Page 1 of 1

GetDist: pad in triangle plots

Posted: July 14 2015
by Jacopo Chevallard
Hi, is there a simple way to add padding (i.e. white space) between the different subplots in a triangle plot?

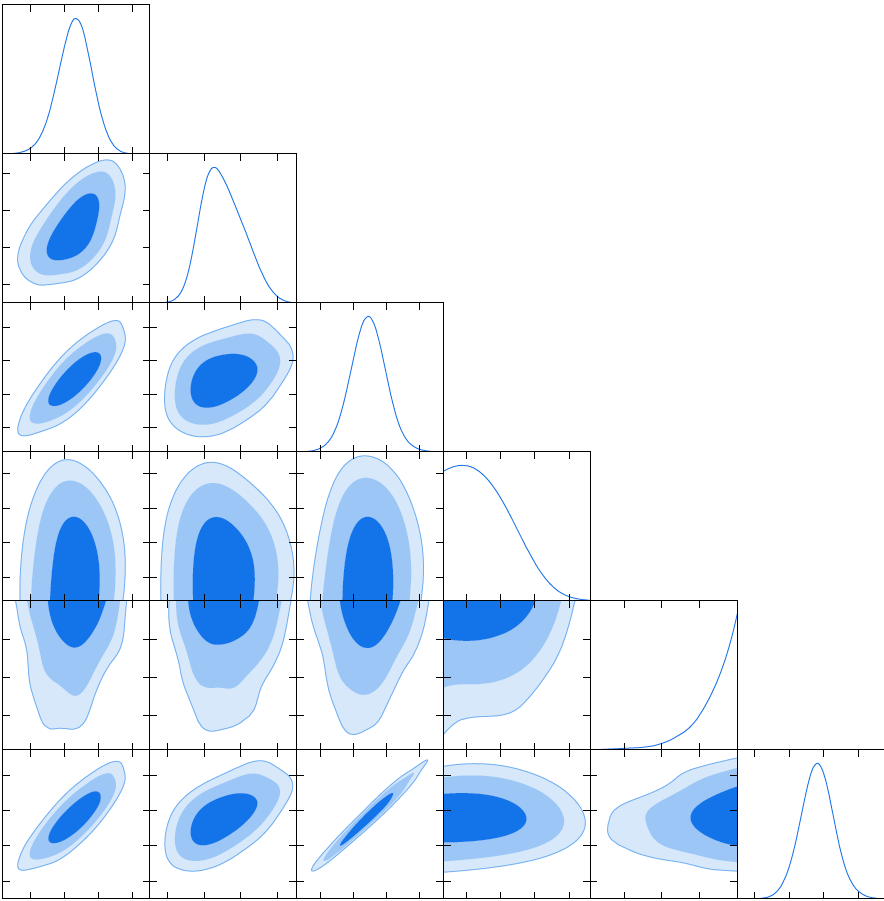
The reason is that in the case of plots like the one below, the lack of pad creates confusion, because of multiple 2D contours reaching the edges of the prior.

Cheers, and congrats for the great work in GetDist (and for the KDE notes which I appreciated a lot)

Image

Re: GetDist: pad in triangle plots

Posted: July 14 2015
by Antony Lewis
You can try setting

Code: Select all

g.settings.no_triangle_axis_labels=False
(where g is the plotting instance). But it may be better just to re-order your parameter names given to triangle_plot so that on of the plots with prior edges is at the bottom.

GetDist: pad in triangle plots

Posted: July 14 2015
by Jacopo Chevallard
Hi Antony, thanks for the prompt reply.

Turning on axis labels is not optimal, as it will just add a lot of useless information and take space from the plots themselves.

And solution #2 is not applicable in my case, I have several thousands of plots, and each one can have different parameters showing this kind of problem (and clearly I don't want to change the parameters ordering among the plots).

Apparently this is the way to go

Code: Select all

fig.subplots_adjust(wspace=0.5, hspace=0.5)
which is a method in figure, or a function in pyplot
  • matplotlib.figure.Figure.subplots_adjust (Python method, in figure)
    matplotlib.pyplot.subplots_adjust (Python function, in pyplot)
Can you point to the right way to implement this in GetDist classes?

Re: GetDist: pad in triangle plots

Posted: July 14 2015
by Antony Lewis
You can probably just call it directly after triangle_plot?

Code: Select all

g.fig.subplots_adjust(wspace=0.5, hspace=0.5)
If you want to generalize the getdist code, you can fork it on github and try adding a new optional parameter that's passed to subplots_adjust in triangle_plot (getdist/plots.py).

GetDist: pad in triangle plots

Posted: July 14 2015
by Jacopo Chevallard
Indeed! I was just calling

Code: Select all

g.subplots_adjust(wspace=0.5, hspace=0.5)
and it wasn't working...

Great!