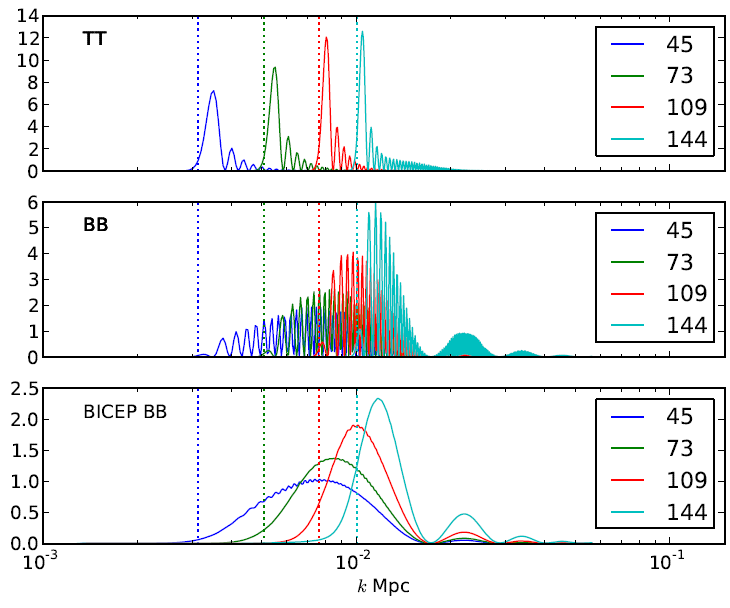
 |
CosmoCoffee
|
[1403.3985]
BICEP2 I: Detection Of B-mode Polarization at Degree Angular Scales
|
Authors: | BICEP2 Collaboration: P. A. R Ade (1), R. W. Aikin (2), D. Barkats (3), S. J. Benton (4), C. A. Bischoff (5), J. J. Bock (2,6), J. A. Brevik (2), I. Buder (5), E. Bullock (7), C. D. Dowell (6), L. Duband (8), J. P. Filippini (2), S. Fliescher |
Abstract: | We report results from the BICEP2 experiment, a Cosmic Microwave Background
(CMB) polarimeter specifically designed to search for the signal of
inflationary gravitational waves in the B-mode power spectrum around l=80. The
telescope comprised a 26 cm aperture all-cold refracting optical system
equipped with a focal plane of 512 antenna coupled transition edge sensor (TES)
150 GHz bolometers each with temperature sensitivity of approx. 300 uk.sqrt(s).
BICEP2 observed from the South Pole for three seasons from 2010 to 2012. A
low-foreground region of sky with an effective area of 380 square degrees was
observed to a depth of 87 nK-degrees in Stokes Q and U. In this paper we
describe the observations, data reduction, maps, simulations and results. We
find an excess of B-mode power over the base lensed-LCDM expectation in the
range 30<l<150, inconsistent with the null hypothesis at a significance of
$>5\sigma$. Through jackknife tests and simulations based on detailed
calibration measurements we show that systematic contamination is much smaller
than the observed excess. We also estimate potential foreground signals and
find that available models predict these to be considerably smaller than the
observed signal. These foreground models possess no significant
cross-correlation with our maps. Additionally, cross-correlating BICEP2 against
100 GHz maps from the BICEP1 experiment, the excess signal is confirmed with
$3\sigma$ significance and its spectral index is found to be consistent with
that of the CMB, disfavoring synchrotron or dust at $2.3\sigma$ and
$2.2\sigma$, respectively. The observed B-mode power spectrum is well-fit by a
lensed-LCDM + tensor theoretical model with tensor/scalar ratio
$r=0.20^{+0.07}_{-0.05}$, with r=0 disfavored at $7.0\sigma$. Subtracting the
best available estimate for foreground dust modifies the likelihood slightly so
that r=0 is disfavored at $5.9\sigma$. |
|
[PDF]
[PS] [BibTex] [Bookmark]
|
View previous topic :: View next topic |
Author |
Message |
Antony Lewis
Joined: 23 Sep 2004 Posts: 1332 Affiliation: University of Sussex
|
Posted: March 19 2014 |
|
|
What an amazing result, which raises a lot of interesting questions!
The high-looking points at l > 150 are obviously a concern: without using Keck array data the shape of expected primordial tensor B spectrum is not there. Taken at face value (which the authors warn against) it seems to favour a lot more power on sub-horizon scales than you'd expect from either primordial tensors or lensing. Combined with Planck's preference for a low TT plateau, which disfavours a large tensor amplitude on large scales, a naive application of the Planck+WP+BICEP likelihood to LCDM+r+nT seems to favour a very non-inflationary nT > 0:
Of course this should not be taken too seriously, since the Keck cross-correlation (their Fig 9) does seem to indicate something more like the expected shape at higher ls, increasing overall confidence in the result and interpretation. The Keck points look systematically lower, which might indicate ultimately something closer to , and consistent with near scale-invariance. Hopefully more data from Keck will pin this down one way or another in relatively short order.
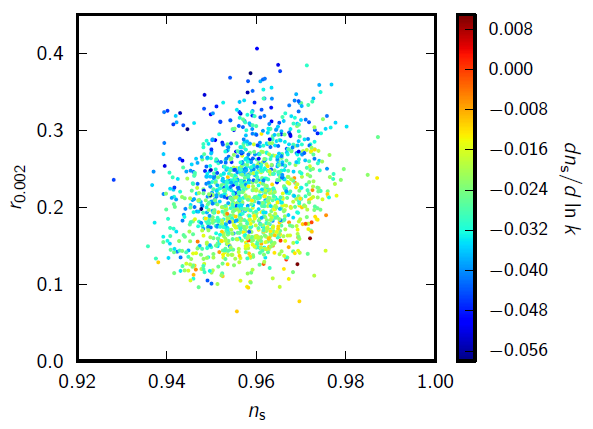
Even if you assume an inflationary consistency relation for nT so that it is nearly scale-invariant, the paper points out that the combination with the preference for low power on large scales in Planck then drives a preference for significantly lower scalar power on large scales than you'd expect from a nearly constant ns vanilla LCDM model. For example allowing running Planck+WP+BICEP gives (95%):
Of course anything else that can lower the large-scale scalar TT can also help to improve consistency, for example a sterile neutrinos allows for bluer ns and hence lower large-scale scalar power:
( gives roughly scale invariant ns and fits about as well as running, though it is hard to motivate an extra sterile neutrino that thermalized at about the same temperature as the active neutrinos, and it is unlikely to improve joint fits on its own)
I look forward to seeing papers on inflationary transients that only strongly affect large scales (e.g. from bubble nucleation, fast-roll, etc) very shortly...
Please note above plots are just a preliminary quick-look and come with usual health warnings. |
|
Back to top |
|
 |
Sesh Nadathur
Joined: 19 Mar 2014 Posts: 3 Affiliation: University of Helsinki
|
Posted: March 19 2014 |
|
|
When fitting to BICEP data do you use bandpowers 1−5 only (as in their paper), or all bandpowers 1−9? |
|
Back to top |
|
 |
Subodh Patil
Joined: 20 Mar 2014 Posts: 3 Affiliation: CERN
|
Posted: March 20 2014 |
|
|
Lots of interesting questions indeed! Although the cross correlation with Keck data does show more of the expected shape at high l's, doesn't it still point to a lack of power at lower l's (c.f. fig 9 of the above reference), suggesting that a preference for a blue tilt would persist in the B2 x Keck cross correlation?
I understand as a naive theorist that there may be lots of remaining foreground issues, uncertainties from polarized dust, EE contamination, sods law etc to be sorted out, but just to put it out there– there are some models of structure formation that can easily generate a large tensor to scalar ratio, which moreover, have predicted a blue tensor tilt that is complimentary to the scalar tilt–
http://arxiv.org/abs/1403.4927
http://arxiv.org/abs/hep-th/0604126 |
|
Back to top |
|
 |
Antony Lewis
Joined: 23 Sep 2004 Posts: 1332 Affiliation: University of Sussex
|
Posted: March 20 2014 |
|
|
This was using E and B from all 9 bins. Non-nT joint constraints don't change very much if you restrict to only five bins or use only B.
If you very crudely replace the BICEP2 points in the likelihood with the BICEP2xKECK points from the figure (thanks Adam Moss), assuming window, covariance, etc, are unchanged, and use just BB, things do change a bit more. For example the nT plot then looks like this:
Here much of the pull to higher nT is presumably coming from the tension with Planck lowl-l rather than the BB spectrum directly, though at least it now looks marginally consistent with scale invariant.
Although the cross-likelihood is a fudge, it does seem to be a reasonable handle on the size of non-foreground systematic errors; the value of r shifts down a bit, as also shown here as the contour superimposed on the BICEP2+Planck sample points:
So the Planck+BICEP+running constraint shifts from r0.002 = 0.22±0.11 (95%) to about r0.002 = 0.14±0.09, though still preferring running at over 2σ. Note that in running models r0.002 gets larger because the large-scale scalar power is decreasing even for the same tensor amplitude; the corresponding numbers at smaller scales are r0.05 = 0.2±0.08 and r0.05 = 0.13±0.8.
Allowing for foregrounds could reduce this by a further 0.04 or so in the BICEP models, taking the signal to a level r≈ 0.1, which sits a bit more comfortably with Planck in simplest inflation scenarios, though tensions in the low-l platau would remain. |
|
Back to top |
|
 |
Sesh Nadathur
Joined: 19 Mar 2014 Posts: 3 Affiliation: University of Helsinki
|
Posted: March 20 2014 |
|
|
The BICEP team are explicitly cautioning against drawing any conclusions from the Keck data, which are still preliminary. For instance, although one could use the B2xKeck spectrum to speculate that with KeckxKeck the high points might come down, at low B2xKeck appears to be consistent with or lower than B2xB1 - and of course B1xB1 shows no detection of r.
But if the preference for blue nT comes as much from Planck low- TT as from any of the high- BB points, then perhaps any detection of sizable r would also favour a blue tilt. |
|
Back to top |
|
 |
Sesh Nadathur
Joined: 19 Mar 2014 Posts: 3 Affiliation: University of Helsinki
|
Posted: March 20 2014 |
|
|
Actually, my naive speculations were probably completely off-base because the Keck error bars will be so much smaller than B1 ... |
|
Back to top |
|
 |
Subodh Patil
Joined: 20 Mar 2014 Posts: 3 Affiliation: CERN
|
Posted: March 20 2014 |
|
|
Thanks, Antony. This is incredibly informative!
Early days yet, but just to comment specifically on the `early transient' models of inflation that exploit initial time fast roll– you'd need a trajectory that stays off attractor for long enough, or a very tuned (and transiently non-flat) potential to get the requisite suppression of power at in large scales. Both of these are in tension with the shift symmetry seemingly required by a the super-Planckian field excursion over the scales we're seeing in the CMB that r = 0.2 implies.
Another naive question to anyone who may know: my understanding was that if r turned out to be of the order of 0.01 - 0.001, we would have needed a PRISM like observation to have meaningfully measured a tilt to anywhere close the accuracy with which we measure the scalar tilt. Now that the indications are that r is at least ten times larger than than, could ground based observations get ever get to the stage where their measurements of the tensor tilt can be comparable to the measurement of the scalar tilt? i.e. if actually there, could one hope even in principle to infer the tensor spectrum to be > 0 with greater than at least 3 sigma confidence, say, from the ground? what are ACTPol and SPTPol's sensitivities in light of r possibly being ~ 0.2? |
|
Back to top |
|
 |
Antony Lewis
Joined: 23 Sep 2004 Posts: 1332 Affiliation: University of Sussex
|
Posted: March 20 2014 |
|
|
The tensor tilt is limited by cosmic variance for large r values, and the BB spectrum falls rapidly at l > 150. This gives a significantly smaller leverarm than with TT and larger cosmic variance on the smallest scales you can see: the ideal measurement of nT from the CMB alone would be like measuring ns from Planck restricted roughly to (without parameter degeneracies). So the best you could do is not good enough to distinguish inflation models that differ only by ΔnT = O( | ns − 1 | ). See astro-ph/0305411. |
|
Back to top |
|
 |
Antony Lewis
Joined: 23 Sep 2004 Posts: 1332 Affiliation: University of Sussex
|
Posted: March 20 2014 |
|
|
For people interested in how parameters move around with different parameter and data combinations, and a more detailed comparison of shifts moving from BICEP2 to fudged BICEP2xKECK BB, here are provisional parameter constraints from a grid of models (including breakdowns of best-fit chi-squareds) as output from CosmoMC March 2014 version:
bicep_planck.pdf |
|
Back to top |
|
 |
Anze Slosar
Joined: 24 Sep 2004 Posts: 205 Affiliation: Brookhaven National Laboratory
|
Posted: March 21 2014 |
|
|
Ok, before I die by tables, is it right that the bottom line is that surprisingly little changes if you add bicep, with or without running? The usual low-z suspects like Om, sigma8 and h remain pretty much unchanged... In other words, low redshift probes will have hard time telling these scenarios apart. |
|
Back to top |
|
 |
Subodh Patil
Joined: 20 Mar 2014 Posts: 3 Affiliation: CERN
|
Posted: March 21 2014 |
|
|
Thanks for that reference, Antony. I wasn't aware of it. If I understand their detectability limits correctly (specifically their fig 3), then it appears that if r > 0.1, one can expect |Δ nT| 0.01 to 0.03 as one ranges the angular resolution of the observation from 1' to 5' and Δp = ω−1/2 (where ω is the weight per solid angle of the stokes parameters) ranges from 15√(2) to √(2) μ K...
This is clearly a very interesting range as far as testing various universality classes of inflationary realizations/ alternatives to inflation are concerned. I'm curious how the various planned/ in progress ground/ space based polarization observations stack up wrt those specs... |
|
Back to top |
|
 |
Antony Lewis
Joined: 23 Sep 2004 Posts: 1332 Affiliation: University of Sussex
|
Posted: March 21 2014 |
|
|
Thanks for pointing that out, I think I mis-remembered the details. The error on nT will always be much worse than the error on ns for sure if you measure to small scales, but as you say it looks as though you can still in principle just get something potentially useful for large . |
|
Back to top |
|
 |
Antony Lewis
Joined: 23 Sep 2004 Posts: 1332 Affiliation: University of Sussex
|
Posted: March 22 2014 |
|
|
There's another interesting point regarding tensor tilt (pointed out to me by Antony Challinor), in that the shape of the large-scale BB spectrum is close white. This comes from the blue spectrum of the sources, so that the low-L (but above reionization) scales in BB are dominated by signiciantly smaller horizon-size modes. The close-to-white shape tells you very little about the spectrum of the underlying sources except that they are quite blue (the same thing happens for the l < 1000 white lensing BB, and also large-scale 21cm/number count angular power spectra with sharp window functions). The large values of nT seen in the above plots therefore work better than you might expect, since the actual range of scales being probed by the BICEP data points is significantly narrowed that you you might expect.
This is illustrated in the following figure of the (normalized) tensor-mode transfer functions
This shows where in k each observable Cl is coming from. Vertical lines denote l = kχ * , and the bottom panel is the middle paanel (for exact L values L=45,73,109,144) multiplied by the BICEP window functions. As you can see at the same L < 100, the TT tensor constributions come from a significantly larger scale than the BB contributions, which bunch up around 0.01/Mpc. You can therefore significantly lower the tensor contributions to Planck TT while keeping the BICEP data points roughly the same, by putting most of the tensor power around 0.01/Mpc. |
|
Back to top |
|
 |
Gansukh Tumurtushaa
Joined: 05 Oct 2013 Posts: 34 Affiliation: Sogang univ.
|
Posted: August 15 2014 |
|
|
Dear all,
I have little bit confused with a difference of the following two data,
first one is a result of BICEP2(lets say A) for r0.002 vs ns which shown here, http://bicepkeck.org/B2_2014_i_figs/running_rvsns.pdf, and
second one is the one posted above, r0.002 vs ns plot (lets say B) with combinations of green,+grey, +red, and +blue).
The problem is that on both blue contours of A and the grey contours of B shows the same r0.002 vs ns plot of Planck+WP+highL+BICEP2 data with running. But if you look carefully at the contours, then you will see that the r0.002 values are different from one another. Therefore my question is simply why they are different while data sets are same for both? Does anyone can explain me? that would be highly appreciated.
Another simple question is that what does the 0.002 or 0.5 the subscript of r imply? I think they are the value of k0 which appear in the denominator of the expression of the power spectrum like Ps=As(k/k0)ns−1. Is that right?
Thank you in advance. |
|
Back to top |
|
 |
|
|
You cannot post new topics in this forum You cannot reply to topics in this forum You cannot edit your posts in this forum You cannot delete your posts in this forum You cannot vote in polls in this forum
|
|